Yardım Kılavuzu
Lütfen bu Yardım Kılavuzunu dikkatlice okuyun.
Okumak istediğiniz bölümün başlığına tıklayarak seçebilirsiniz.
Sürümler ve İndirme
iPazar Terminali, daha yeni işletim sistemleri, eski Windows ve MacOS sürümleri veya Linux dağıtımları için
bir depolama uygulaması olarak çalışır
Java ile çalışabilir.
Mağaza uygulamaları, kullanıcıya bu kategorideki tüm uygulamalar için tek bir basit kurulum,
güncelleme, açma ve kaldırma yöntemi sunarken önemli güvenlik ve işlevsellik avantajlarına sahiptir.
Diğerlerinin yanı sıra, işletim sisteminin üreticileri (Microsoft, Apple, Google gibi) tarafından kontrol
edilir ve dağıtılırlar,
çünkü hakları işlevsel olarak gerekli olanlarla sınırlıdır (müşteri olarak internet bağlantısı, baskı,
vb.).
Hem masaüstü hem de mobil sürümler tam olarak aynı özelliklere ve işlevselliğe sahiptir.
Tek fark, aynı anda görüntülenebilecek pencere sayısı ve bunların nasıl düzenlendiğidir.
Mobil Versiyon
Mobil versiyonda, içerikleri kullanıcı tarafından tanımlanabilen 12 ekran konumu vardır.
Yeterli alana sahip cihazlarda, ayrıca Seçenekler simgesinden ekranı paylaşma ve ardından ana ekranın altına
veya yanına ikinci bir küçük ekran Ekle/Kaldır seçeneği de vardır.
Simgeyi 2 ekranın sınırına sürükleyerek, bunların göreceli boyutlarını değiştirebilirsiniz.
İki ekrandan biri bir liste içeriyorsa ve diğeri liste öğelerini kabul edebiliyorsa, bir liste sembolüne
tıklayarak diğer ekranın içeriğini değiştirebiliriz, tabii ki bu ekran kilitli değilse.
Bir noktaya çift tıklamak veya uzun süre basmak, bilgisayarlarda sağ tıklamaya eşdeğerdir.
Giriş Yapmak
Uygulamaya doğru Kullanıcı Adı ve Şifreyi girerek giriş yapın.
"Kodu Kaydet" seçeneğine tıkladıysanız Kullanıcı Adı cihazınıza kaydedilecektir.
Dil göstergesinden uygulamanın dil düzenini Türkçe / İngilizce arasında değiştirebilirsiniz.
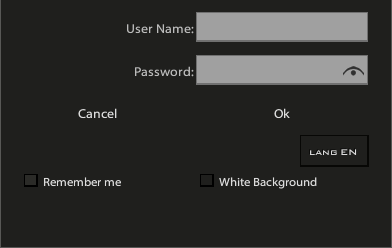
"Beyaz Tema" sekmesinden uygulamanın temasını Siyah / Beyaz arasında değiştirebilirsiniz.
Listeyi Görüntüle
Aç
Yeni bir izleme listesi penceresi açmak için Menü
"Pencereler" -> "Yeni" öğelerine tıklayın ve "Listeyi Görüntüle"
öğesini seçin
Listeye Sembol Ekleme/Kaldırma
Listeye yeni bir sembol, sol üstteki
"Sembol ekle"ye tıklanarak eklenebilir. Yeni sembol listenin başına eklenecek ancak başka bir yere
sürüklenebilir
veya sağ tıklamayla listeden kaldırabiliriz.
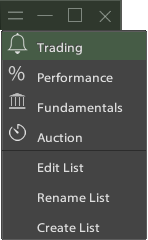
"Seçenekler" simgesinden (sağ üst köşe) ve ardından "Listeyi Düzenle"
daha fazla sembolü daha kolay ekleyebilir, kaldırabiliriz.
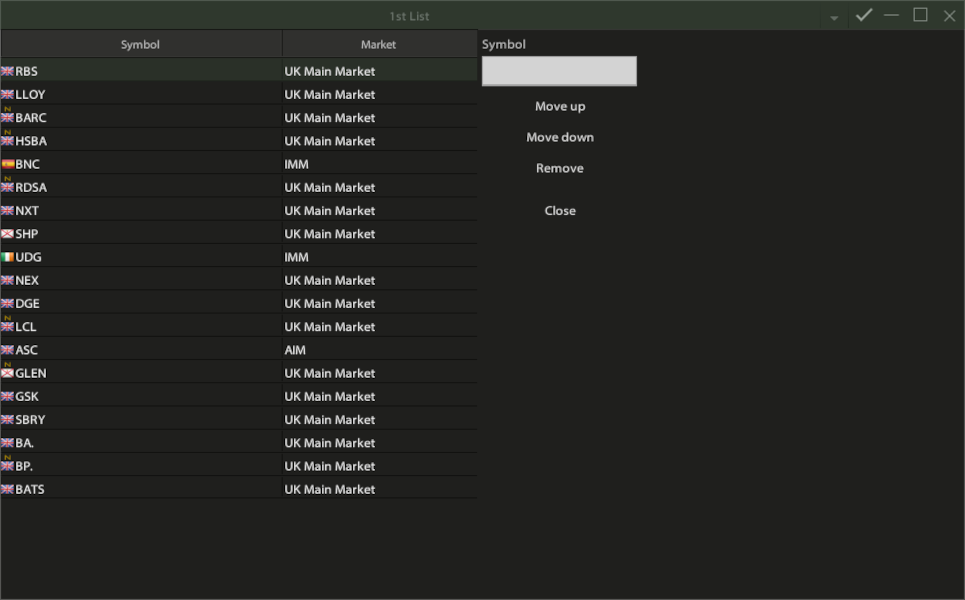
İstediğiniz simgeye tıklayın ve ardından "Kaldır" veya "Yukarı Taşı" veya "Aşağı Taşı" düğmesine basın.
Düzenleme listesini tamamladıktan sonra, pencerenin sağ üst köşesinde görünen "İşaretle" düğmesine
tıklayın.
Tüm uygulama verileri gibi görünüm listeleri de personelinizde saklanır
ve bu nedenle tüm cihazlarınızda ortaktır
(aynı kullanıcı adıyla oturum açtığınızda).
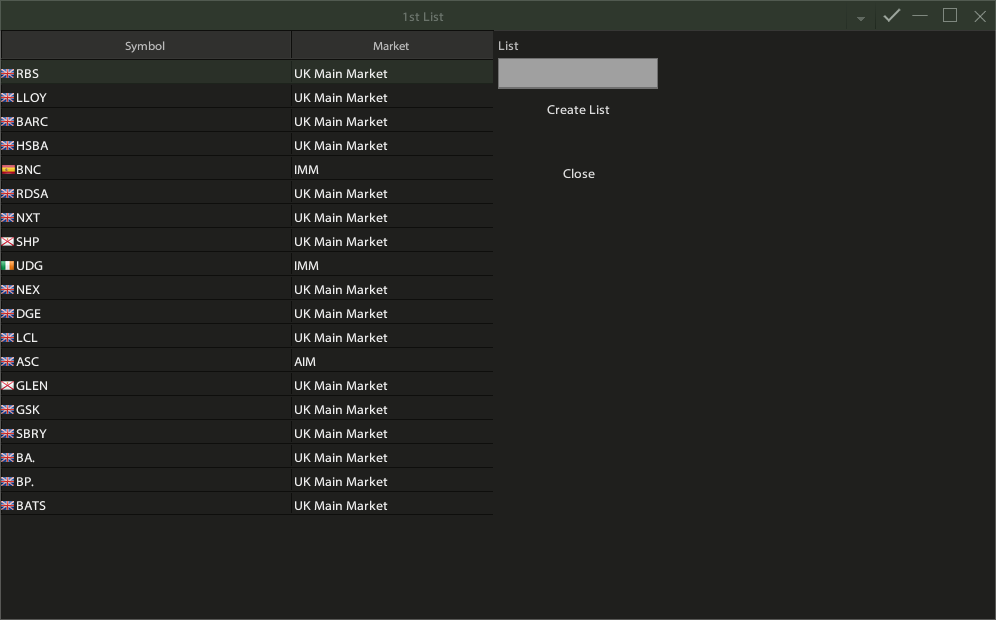
Yeni Görünüm Listesi Oluştur
Yeni bir Görünüm listesi oluşturmak için
penceresinin sağ üst köşesindeki seçenekler düğmesine tıklayın ve ardından -> "Liste Oluştur"a tıklayın.
Metin alanına yeni listeye vermek istediğiniz adı yazın ve
"Liste Oluştur" düğmesine basın.
Ardından, "Sembol (sembol ekle)" alanına yazarak herhangi bir sembol ekleyebilirsiniz.
Listeyi düzenlemeyi bitirdikten sonra,
Liste oluşturma penceresini kapatmak ve yeni Listenizi kaydetmek için
penceresinin sağ üst köşesinde görünen "İşaretle" düğmesine tıklayın.
Yeni bir Listeyi kaydetmek için boş olmaması gerektiğini unutmayın, yani en az bir (1) sembol
içermelidir.
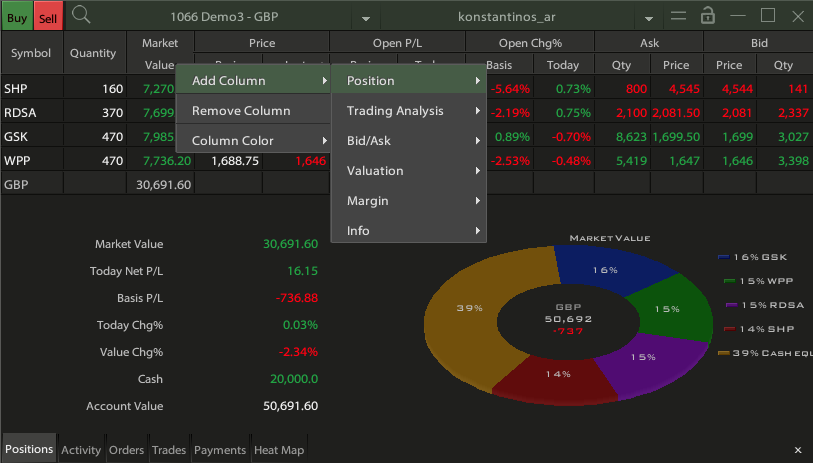
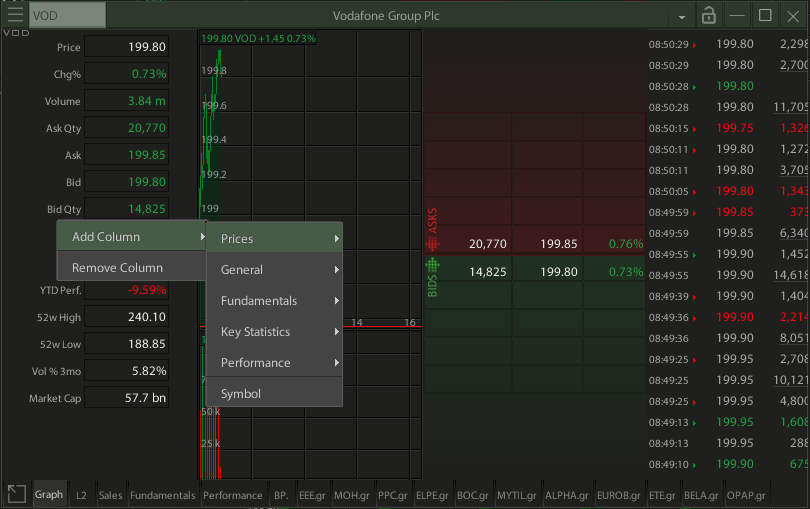
Sütun Ekle/Kaldır
Bir sütun başlığına sağ tıklayın (veya uzun tıklayın) ve bir sütun ekleyin veya kaldırın.
Sütunu ekranınızda (çerçeve) sola/sağa taşıyabilirsiniz,
sürükle ve bırak işleviyle.
Sütunun öğelerine göre artan veya azalan düzende listeyi sıralamak için bir sütun etiketine tıklayın.
Seçimi kaldırmak için tekrar tıklayın.
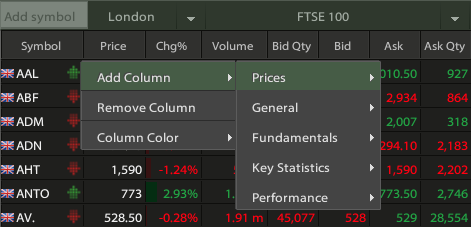
Sütun Kümesi
Seçenekler düğmesine tıklayarak (sol üstte) sütun kümesini
İşlem, Performans, Temel Bilgiler ve
Müzayede olarak değiştirebilirsiniz (son sütun kümesi, Fiyat Hesaplaması
/ Değişim Hesaplaması sütunlarının eklenmesiyle İşlem ile aynıdır ve
Piyasa Ön Oturumdayken ve gün sonunda otomatik olarak görüntülenir).
Bu sütun toplamlarını sütun ekleyerek veya kaldırarak veya genişliklerini değiştirerek
değiştirebilirsiniz.
Tüm sütun kümeleri kişisel profilinizde saklanır.
Alıntı
Aç
Yeni bir Teklif penceresi açmak için "Pencere" -> "Yeni" öğelerine tıklayın
ve ardından "Teklif" öğesini seçin
veya ana menüde görünen Teklif kısayol simgesine tıklayın.
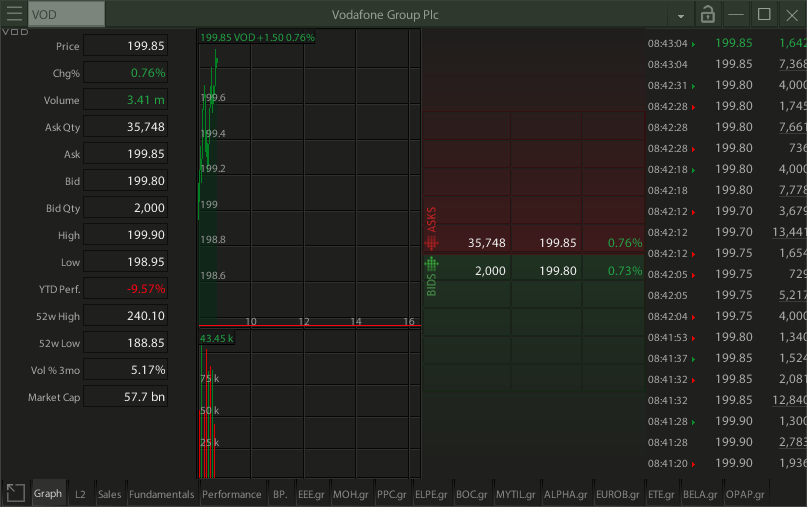
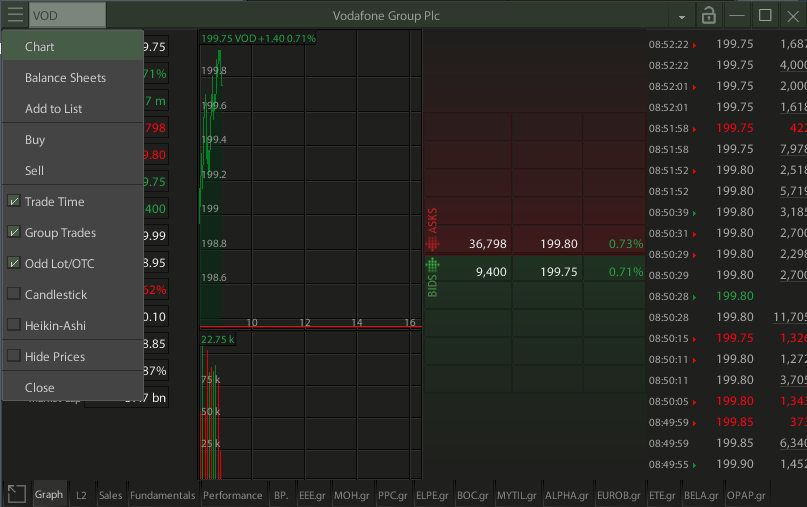
Teklif Seçenekleri
Teklif Seçenekleri Teklif ekranında mevcut seçenekler şunlardır:
"Haberler" (seçilen sembol için duyurulan bir haber varsa), "Derinlik", "Emirler",
"Performans" ve "Temeller". Yukarıdakilerden herhangi birini, pencerenin alt satırında gösterilen
seçeneklere tıklayarak seçebilirsiniz.
Eylemler sekmesinde, seçilen sembolün son eylemleri görüntülenir.
Derinlik sekmesinde, seçilen sembol için piyasanın derinliğini (Teklif/Satış) görüntülersiniz.
Maksimum simgesine tıklayarak seçenekler alanını genişletebilir
ve ardından aynı eylemle sıfırlayabilirsiniz.
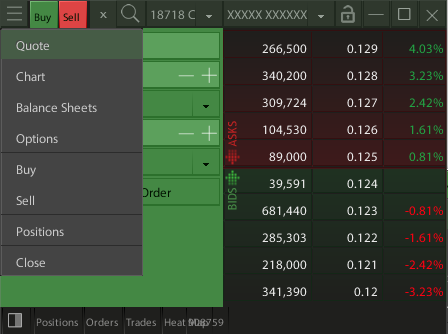
Hızlı Geçiş
Seçenekler simgesinden (sağ üst köşe) doğrudan
Grafik, Bilançolar, seçili sembol için Alım/Satım Emri'ne gidebilirsiniz.
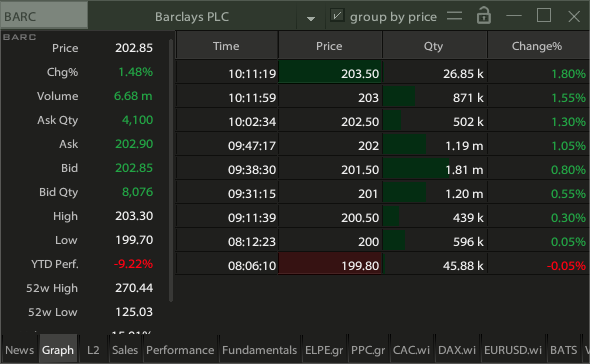
Siparişler
Klavyede Ctrl+T'ye basarak veya Seçenekler simgesine (sağ üst köşede) h
basarak, izlemekte olduğunuz sembol için tüm işlemlerin listesi inceleme penceresinde görüntülenir. Mevcut
sembol için gerçekleşen
tüm işlemleri görüntülemeyi veya "değere göre gruplandır" kutusunu işaretleyerek bunları değere göre
gruplandırmayı seçebilirsiniz.
Grafikler
Aç
Yeni bir grafik açmak için Windows -> Yeni menüsüne tıklayın ve ardından Grafik'i seçin veya kısayol
simgesine tıklayın
ana menüde görüntülenen grafikler.
Teknik analiz uygulamasında, oturum içi veriler için 120 günlük zaman aralıkları, 10 yıllık günlük veriler
ve 15 yıllık
haftalık/aylık veriler için 5/10/30/60/120/240 dakika/gün/hafta/ay periyotlarında canlı grafikleri
görebilirsiniz.
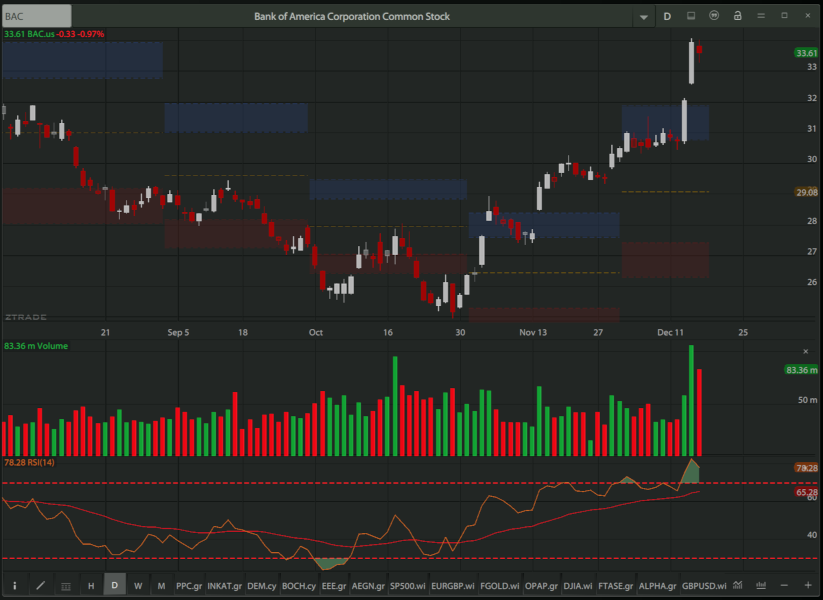
Göstergeler Ekleme
Menü simgesine (çubuğun en üstünde) dokunarak göstergeler ve hareketli ortalamalar ekleyebilirsiniz.
Düzenleme kutusundan (sol üst köşe) sembolün adını yazıp "Enter"a basarak başka bir sembolü
çağırabilirsiniz
veya sembol adına (üst orta/Sembol Başlığı) tıklayıp son sembol listesinden bir sembol seçebilirsiniz.
Çubuğun en üstündeki boşluk simgesiyle grafik aralığını değiştirin.
"Eksi" veya "Artı" tuşuna (pencerenin sağ alt köşesinde) basarak yakınlaştırın veya uzaklaştırın.
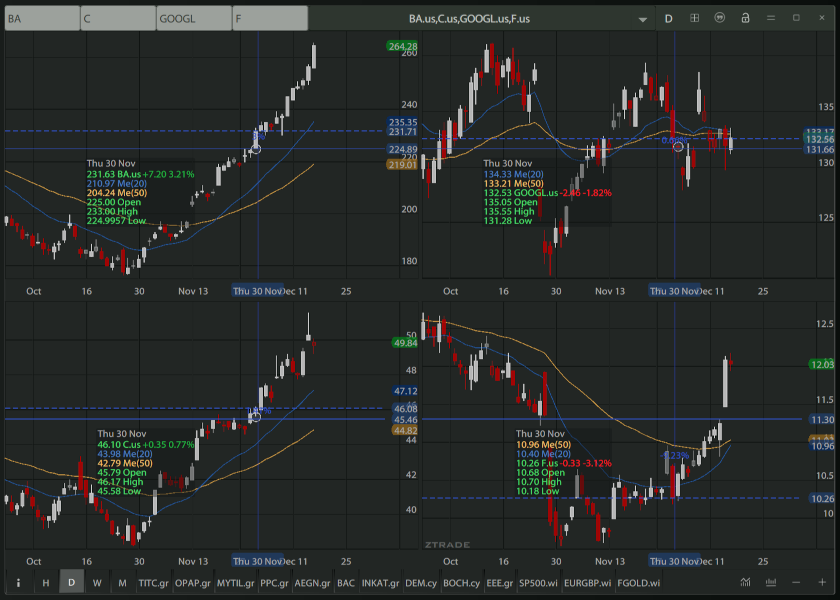
Çoklu Görünüm
Çoklu görünüm düğmesine (sağ üst köşede) basarak,
2 veya 4 sembol grafiğini aynı anda izlemek için görünümün görüntülenmesini seçebilirsiniz.
Çizgi Çizme
"El" simgesinin bulunduğu imleç modu (pencerenin sol alt köşesinde) "Normal" moddur,
grafikte bir değerler tablosunu görüntülemek için "Yüzen bilgi"yi veya oymaya başlamak için Çizgi
Grafiğini seçin.
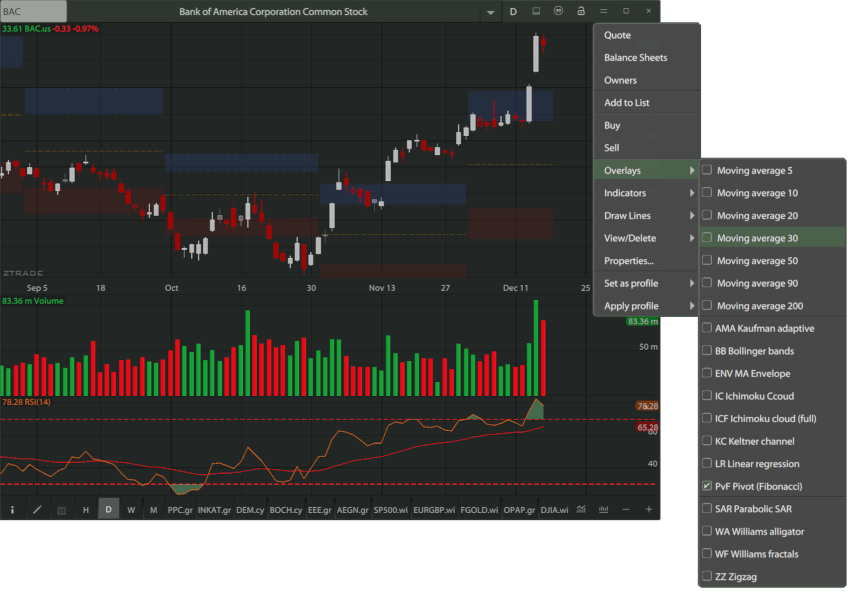
Menü simgesine tıklayıp ardından Çizgi Çizimi'ni seçerek daha fazla
çizim modu (Fibonacci Geri Çekilmeleri, Kare veya hatta Metin) seçebilirsiniz.

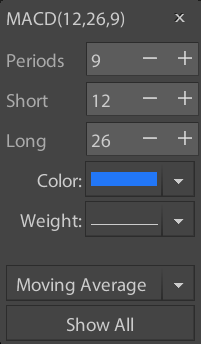
Parametreleri değiştir
Bir diyagram çizgisine sağ tıklamak (veya uzun tıklamak) çizgi ayarları Menüsünü görüntüler,
burada renk stilini değiştirebilir, çizgiye hareketli ortalama ekleyebilir veya çizgiyi silebilirsiniz.
Grafikteki gösterge setini menüyü seçerek varsayılan şablon olarak kaydedebilir
ve ardından Şablonu Kaydet'i seçebilirsiniz, bundan sonra herhangi bir yeni grafik kaydedilmiş katmanlarla
ve kişisel parametrelerinizle göstergelerinizle açılacaktır.
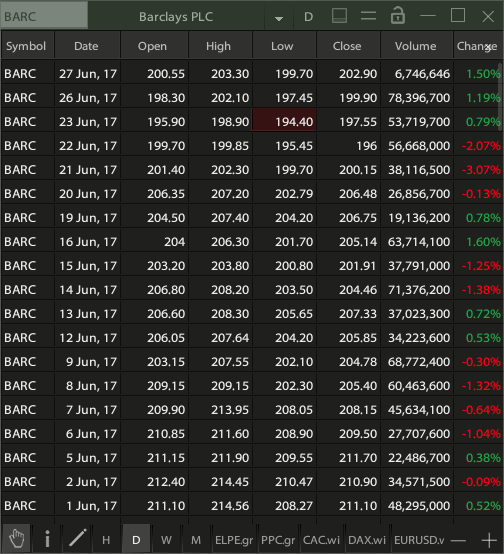
Fiyat Geçmişini Göster
Grafik değerlerini bir listede göstermek için Ctrl+T'ye basın.
Ekranın alt kısmındaki
öğesini seçerek veya simgeyi istediğiniz döneme değiştirerek listenizin zaman çerçevesini grafik gibi
değiştirebilirsiniz.
Ctrl+T'ye tekrar bastığınızda grafik penceresine dönersiniz.
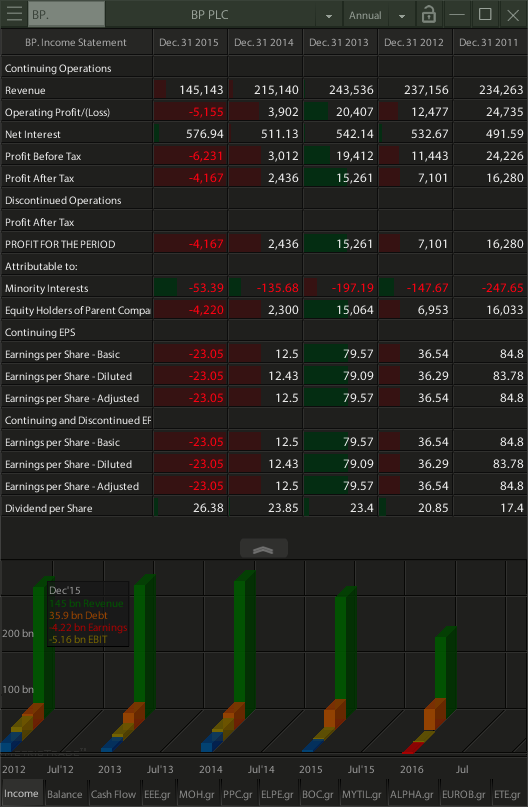
Temel veriler
20 Son Çeyrek
Temel veriler, hisse senedi analizinde en önemli verilerdir.
Temel analizin ihtiyaçlarını karşılamak için uygulama, grafikleriyle birlikte tam verilerle birlikte 20'ye
kadar son çeyrek sağlar.
Aç
Yeni bir bilanço penceresi açmak için Windows -> Yeni'ye tıklayın ve ardından Bilançolar'ı seçin veya ana
menüde görünen Bilançolar'ın Kısayol simgesine tıklayın.
Kullanıcı, grafiksel gösterimini almak için Bilanço'nun herhangi bir satırına tıklayabilir ve grafikten
kaldırmak için aynı satıra tekrar tıklayabilir. Grafik alanı, kaydırıcı simgesini sürükleyerek yeniden
boyutlandırılabilir.
Çeyreklik grafiklerde borcun, çeyreklik satış ve karlarla karşılaştırılabilir olması için bir çeyrek borcu
(Borç/4) temsil ettiğini unutmayın.
Temel Analiz Kuralları
Kullanıcının bakış açısından Temel analizdeki en önemli kurallar şunlardır:
Uzun vadede hisse senedi fiyatı büyümesi satış büyümesiyle desteklenmelidir.
Kar büyümesi satış büyümesiyle desteklenmelidir.
Sonuç olarak, 1 Yıllık Gelirdeki % Değişimi .
(önceki yıla kıyasla en son dört çeyrek satışları) ve 3 Yıllık Gelirdeki Değişimi
(önceki yıla kıyasla son on iki üçte birlik satışlar) kontrol ederek pozitif gelir
(satış) değişimleri olan hisse senetleriyle işlem yapmak tavsiye edilir.
1'deki veya tüm görünümlerde (izleme listesi veya İnceleme) sağlanan değişiklikleriyle birlikte zengin bir
finansal göstergeler seti.
İzleme listelerinin temel ayak izini görmek için "Zil" simgesine tıklayabilir
(sağ üst) ve ardından menüden Temeller'i seçebilirsiniz.
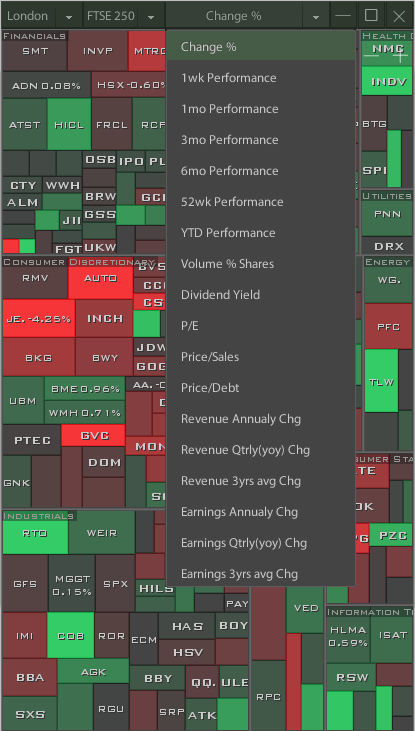
Isı haritası
Grafikler, karmaşık verileri sentezleyerek daha hızlı ve daha iyi kararlar almanıza yardımcı olan
kanıtlanmış yatırım araçlarıdır.
Açma
Yeni bir Harita penceresi açmak için Pencere -> Yeni'ye tıklayın ve Harita'yı seçin.
Haritadaki herhangi bir sembole tıklayarak, seçili Piyasa sekmesinde kilidi açılan herhangi bir pencerede
İnceleme veya
Grafik'e hemen sahip olabilirsiniz.

Diğer boyutları karşılaştırın
Sağdaki etikete (Değişim %) tıklayarak menüden karşılaştırmak için başka bir değer seçebilirsiniz.
Görüntülenen renk karakteristik değere (düşüş/yükseliş) bağlıdır.
Sembolün kapsama alanı her zaman piyasa değerine bağlıdır.
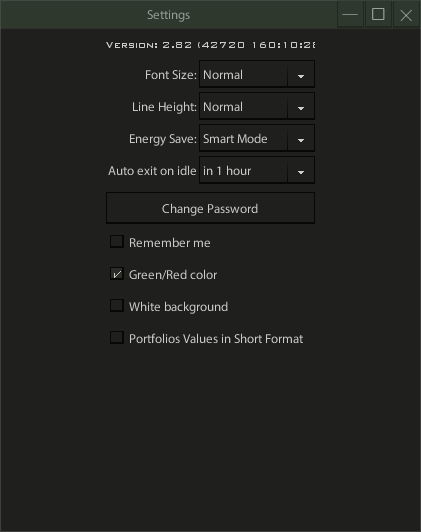
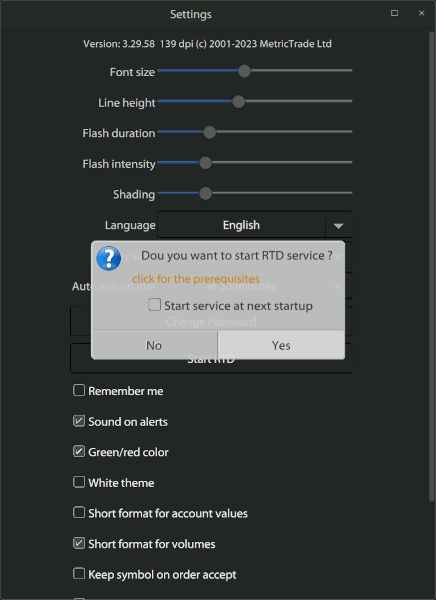
Ayarlar
Ayarları Aç
Uygulama ayarlarını açmak için Windows -> Ayarlar'a sol tıklayın.
Ayarlar şunları içerir:
• Yazı Tipi Boyutu: Rahatlığınız için yazı tipi boyutunu Küçük / Normal / Büyük / Çok Büyük
harflerden değiştirebilirsiniz.
• Satır Yüksekliği: Satır yüksekliğini değiştirmek, düğmeleri otomatik olarak yeniden boyutlandırır
ve daha okunabilir ve kullanımı daha kolaydır.
• Flaş Süresi: Bu ayarla hücrelerin flaş süresini değiştirebilirsiniz.
• Parıltı Yoğunluğu: Bu ayarla hücrelerin parıltı yoğunluğunu değiştirebilirsiniz.
• Dil: Bu ayarla sistem dilini (Türkçe/İngilizce) seçebilirsiniz. Bu seçenek, kullanıcının Kullanıcı
Adı/Giriş Kodunu verdiği ilk giriş resminde de mevcuttur.
• Tüketim: Uygulama veri tüketimi açısından yapılandırılabilir
(düzenleme esas olarak mobil cihazlar için geçerlidir). Seçenekler Akıllı / Her zaman ekonomi / Ekonomi
yok'tur.
• Beklemede çıkış: Uygulama, güç ve veri tüketimini durdurmak için
10 dakika / 30 dakika / 2 saat / 8 saat / 12 saat seçeneğinde ayarlanan süreden sonra otomatik olarak
kapanır.
Pil seviyesine (%30) bağlı olarak, bu seçeneği yok sayar ve
10 dakika hareketsizlikten sonra kapanır. (Bu özellik Masaüstü Sürümü için geçerli değildir).
• Şifreyi Değiştir: Girişinizin şifresini değiştirmek için bu düğmeyi kullanın (Yalnızca iPazar
Kullanıcı Adı/Şifre için geçerlidir).
• RTD/DDE'yi Başlat/Durdur: Bazı masaüstü sürümleri diğer uygulamalarla veri alışverişi
protokollerini destekler (Windows 10: RTD ve Java: DDE).
Başlat'ı seçerek, aşağıdaki bağlantıları takip ederek veri gönderme hizmetini (ör. Excel)
barındırabilirsiniz
bilgisayarınıza gerekli DLL'leri yüklemiş olmalısınız: RTD önkoşulları veya DDE önkoşulları
Formüllerin oluşturulması, istediğiniz bir görünüm listesinde Ctrl+Shift+C tuşlarına basıp ardından
Excel'e yapıştırarak kolayca yapılır.
• Parolayı Kaydet: Parolayı Kaydet seçiliyken, uygulama kullanıcı adını cihaza kaydeder (parola
yalnızca MetricTrade kodlarında kaydedilir).
• Uyarı Sesi: Bu seçeneği etkinleştirerek, bir uyarı geldiğinde bilgisayarın hoparlörlerinden bir ses
sinyali duyarsınız.
• Yeşil/Kırmızı Renk: "Mavi/Kırmızı" yerine "Yeşil/Kırmızı" renklerini değiştirin.
• Beyaz Arka Plan: Uygulama arka plan rengini "Beyaz/Siyah" olarak değiştirin.
• Kısaltılmış Pozisyon Değerleri: Portföylerdeki fiyatların kısa gösterimini ve ondalıkların
kesilmesini gösterir, örneğin 23.340,12 yerine 23,34K.
• Kısaltılmış Hisse Senedi Hacimleri: Parça hacimlerinin kısa gösterimini ve ondalıkların kesilmesini
gösterir, örneğin 23.000 yerine 23K.
• Sembolü Komutta Tut: Bu seçenek, Sembol alanını komut penceresinde dolu tutmamızı sağlar.
• Miktarı Siparişte Tut: Bu seçenek, Miktar alanını sipariş penceresinde dolu tutmamızı sağlar.
• Yeni Siparişte Müşteri Kodu Yok: Bu seçenek etkinleştirildiğinde, sistem her yeni siparişte müşteri
kodunun girilmesini ister.
• Boş Sembolleri Göster: Bu seçenek, boş olan (değeri olmayan) sembolleri göstermemizi veya gizlememizi
sağlar.
• Satın Alma/Satış Renklendirmesi Yok: Bu seçenek etkinleştirildiğinde, Satın Alma/Satış alanları düz
renktir ve seçili deseni (kırmızı/yeşil-kırmızı/mavi) takip etmez.
Yukarıdaki ayarların tümü cihaza özgüdür ve diğer seçenekleriniz gibi taşınmaz.
Bildirimler
Uyarılar penceresinde, bir menkul kıymetin bir fiyatın üstünde mi yoksa altında mı olduğuna dair uyarılar
ayarlayabilirsiniz.
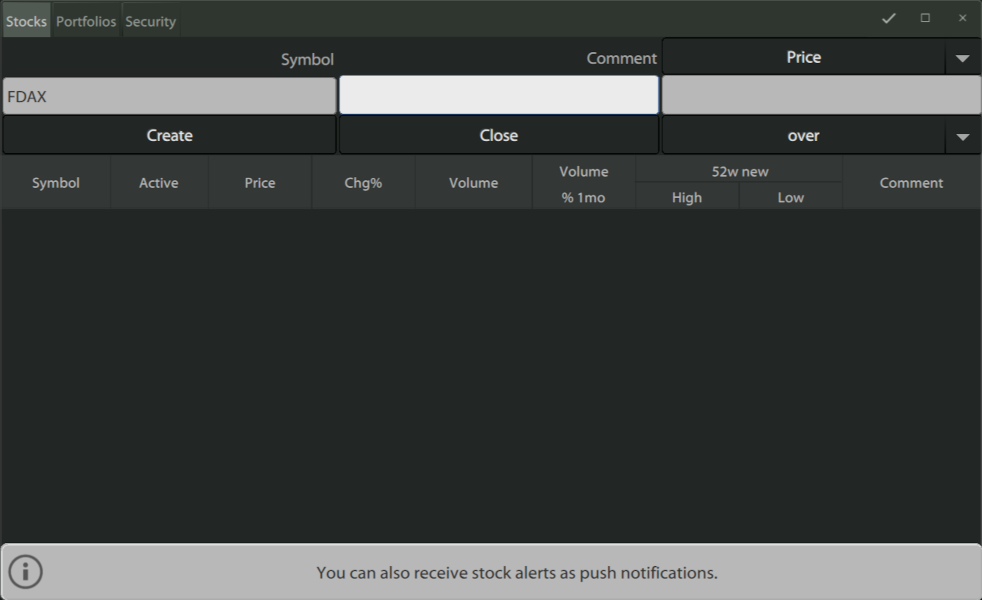
Kriter Türünü değiştirerek uyarı kriterlerini değiştirebilirsiniz.
Mevcut seçenekler "Fiyat", "Hacim", "Değişim" ve "Hacim % 1 gün"dür.
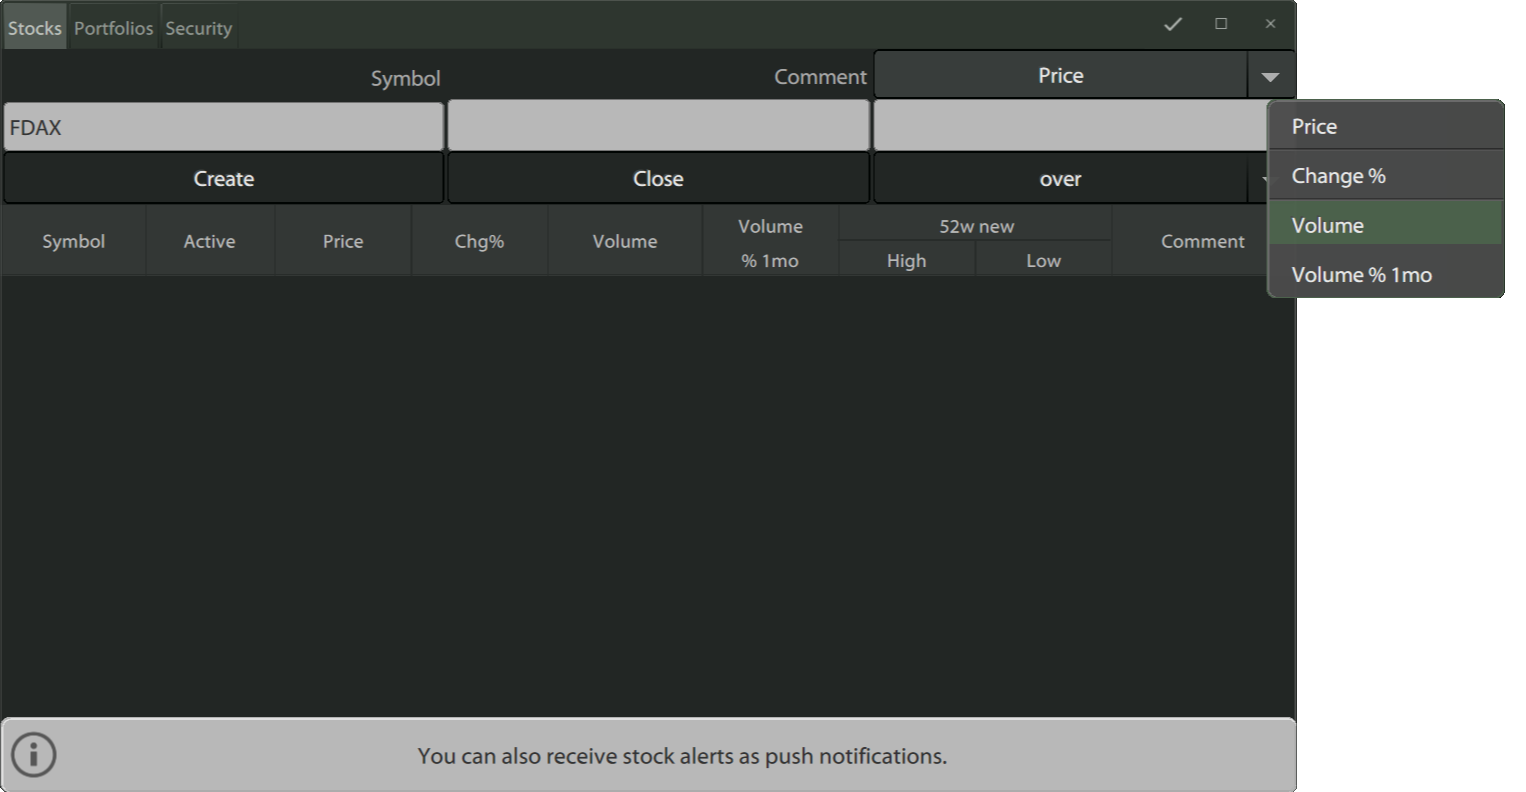
Ayrıca bildirimle birlikte görünecek bir yorum da ekleyebilirsiniz.
Uygulama ayarlarından (paragraf 3), bir bildirimin görüntülenmesine eşlik eden ses efektini
etkinleştirebilir veya devre dışı bırakabilirsiniz.
UYARI: Uygulama çalışmıyorken bildirimler çalışmaz.
Siparişler ve Portföyler
Siparişler
Yeni bir Emir vermek için aşağıdaki yollarla bir Emir penceresi açmalısınız:
1. Bir sembole sağ tıklayın (veya mobilde çift tıklayın veya basılı tutun veya Ctrl tuşuna basarak
tıklayın)
ve menüden Buy Order veya Sell Order'ı seçin.
2. Bir portföy ekranından sembollerden birini seçerek (sol üst köşe)
Alım Emri veya Sell Order'ı seçin.
3. Simge menüsünden (sol üst köşede) Buy Order veya Sell Order'ı seçin.
4. Tablet veya PC'de Buy veya Sell Price veya Quantity alanlarına tıklayarak.
5. Komutlar listesinden bir komuta tıklayın ve Clone Command'ı seçin.
6. Simge çubuğundaki komut kısayoluna tıklayın.
7. Ana menüden Windows -> Yeni -> Yeni Komut'a tıklayarak.
8. PC'de, Buy için Ctrl-B'ye veya Sat.
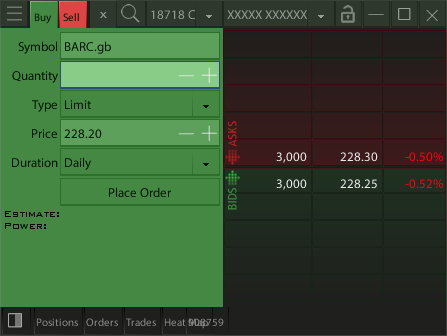
Komut penceresi bir telefonda geçici (tam) ekran olarak veya bir Tablet veya PC'de küçük bir açılır
pencere olarak açılacaktır.
Türkçe dilinde ondalık nokta , (virgül) ve İngilizce'de . (nokta)'dır.
Miktar ve fiyatta, mevcut fiyat adımına göre miktarı veya fiyatı değiştirmek için sembolleri veya klavyedeki
+/- tuşlarını kullanabilirsiniz.
Alım/satım derinliğinde bir fiyata sağ tıklandığında fiyat emrinize aktarılır.
Bilgileri girmeyi bitirdiğinizde, genel bakış penceresini açmak için Gönder'e basın, okuduktan sonra komutu
göndermek için Evet'e basın.
Soldaki genel bakış penceresindeki piyasa uyarısı, olasılık emrinin hemen yürütüleceği anlamına gelir,
bu nedenle bir emri beklemeye almak istediyseniz tekrar bakın.
Komut Genel Bakışı / Değiştir / Sil
Emir Listenizi görüntülemek için portföylerin veya emirler penceresinin alt satırında "Emirler"i
seçebilirsiniz.
Ana Menü'den Windows -> Yeni -> Komut Merkezleri'ne tıklayarak.
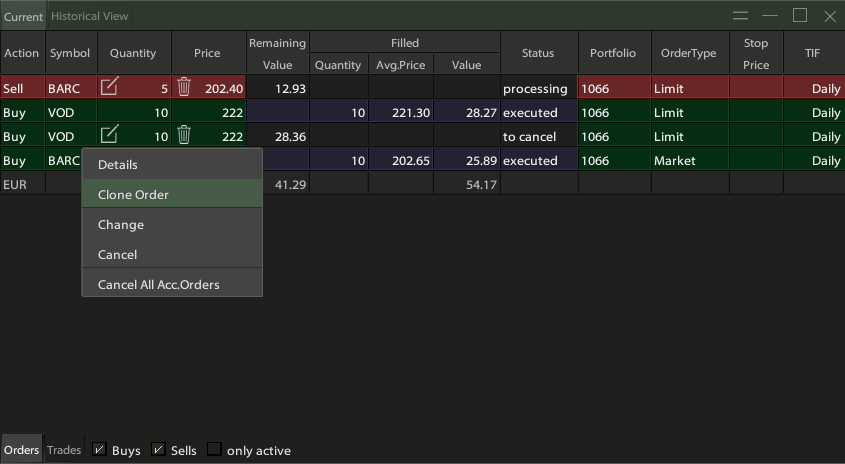
Komut Listesi
Komut Listesinde, seçili emri veya geçerli portföydeki tüm emirleri klonlamak, değiştirmek/düzeltmek,
iptal etmek için menüyü etkinleştirmek üzere herhangi bir komut satırına tıklayabilirsiniz.
Yalnızca Etkin seçeneğini (pencerenin alt satırında) seçerek iptal edilen veya yürütülen emirleri
gizleyebilirsiniz.
Eylemler sekmesini (pencerenin alt satırında) seçerek
yalnızca çalıştırmalarınızı görebilir ve bunları sembole göre gruplayabilirsiniz.
Komut Geçmişi
Sipariş geçmişinizi görüntülemek için "Geçmiş" sekmesini seçin.
Ardından "Başlangıç" - "Bitiş" tarihini girebilir ve Ara düğmesine basabilirsiniz.
Tüm geçmiş hareketleriniz görüntülenecektir. Bunları sağ alttaki ölçütleri (Alımlar - Satışlar - Yalnızca
Aktif) seçerek gruplayabilirsiniz.
Aynı pencerede eylem sekmesini seçerek yalnızca
gerçekleştirilen eylemleri görürsünüz.
Portföyler
Pozisyonlarınızı görmek için "Windows" -> "Yeni" menüsüne tıklayın ve ardından
"Portföyler" seçeneğini seçin veya ana menüdeki Portföy kısayoluna tıklayın.
Sütunları Düzenle
Bir sütunu silmek veya yenilerini görüntülemek için bir sütun başlığına sağ tıklayın (veya uzun
tıklayın).
Portföyünüzün özetini veya performansını veya dağıtımını görmek için özet/performans penceresini
sürükleyin.